Study 1

Tweets-based study

We track the news about the COVID-19 pandemic that major newspapers post on Twitter. This new dataset lets us study both how information is produced and how it spreads. Because we also track retweets and likes, we get a high-frequency measure of attention.

Interactive

Average COVID-related tweets per major newspaper, by country

Total COVID-related tweets (bars, left axis) and retweets (diamonds, right axis), each divided by the number of major newspapers tracked in that country. Based on Table 3 of the paper; sample 01/01/2020–02/22/2022.

Takeaway 1

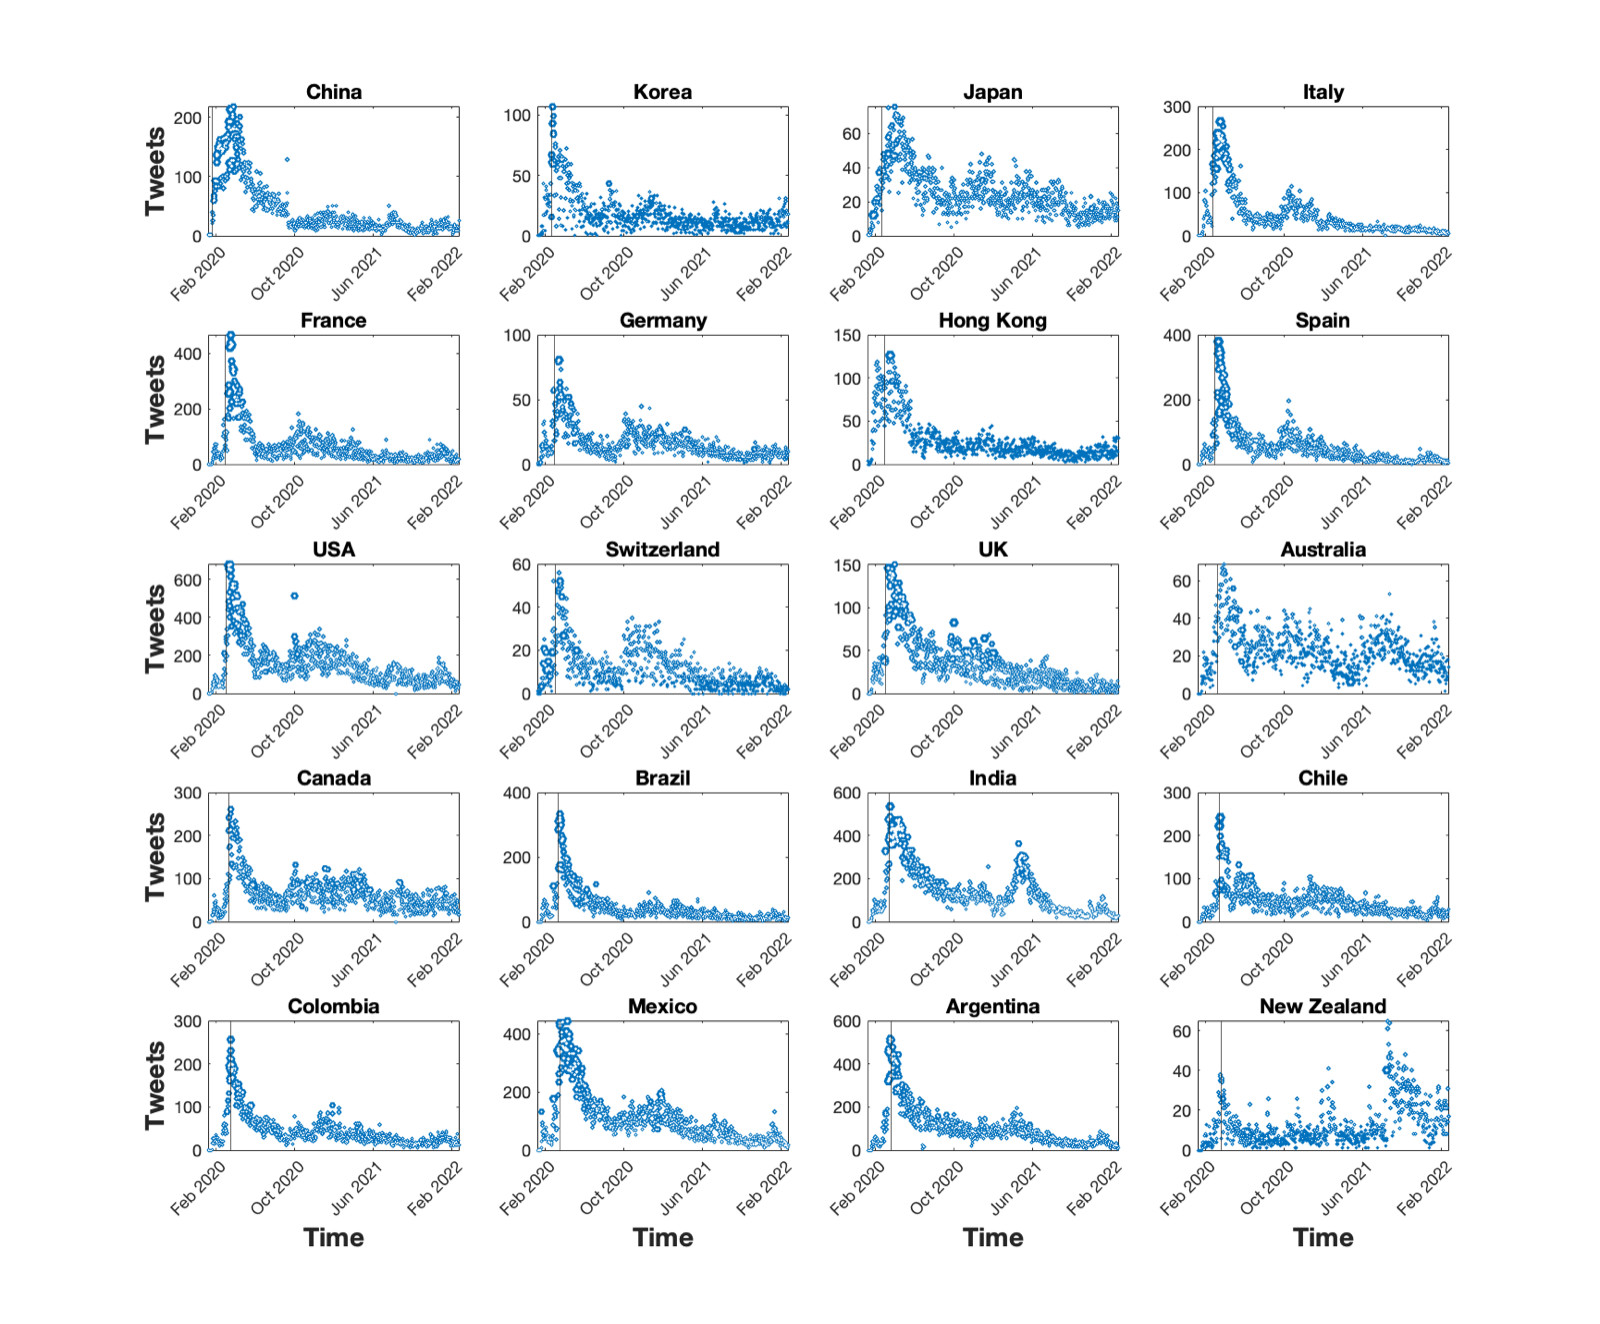
The timing of information diffusion differs a lot across countries. In several of them, diffusion becomes much more intense once the local epidemic period starts (100+ confirmed cases).

Interactive

COVID-related tweets per major newspaper over time (monthly)

Five countries are shown to start. Click a country code in the legend to add or remove it; double-click to show it alone.

Monthly count of COVID-related tweets divided by the number of major newspapers in each country.

The tone of the news

The tone of the tweets follows the contagion

Takeaway 2

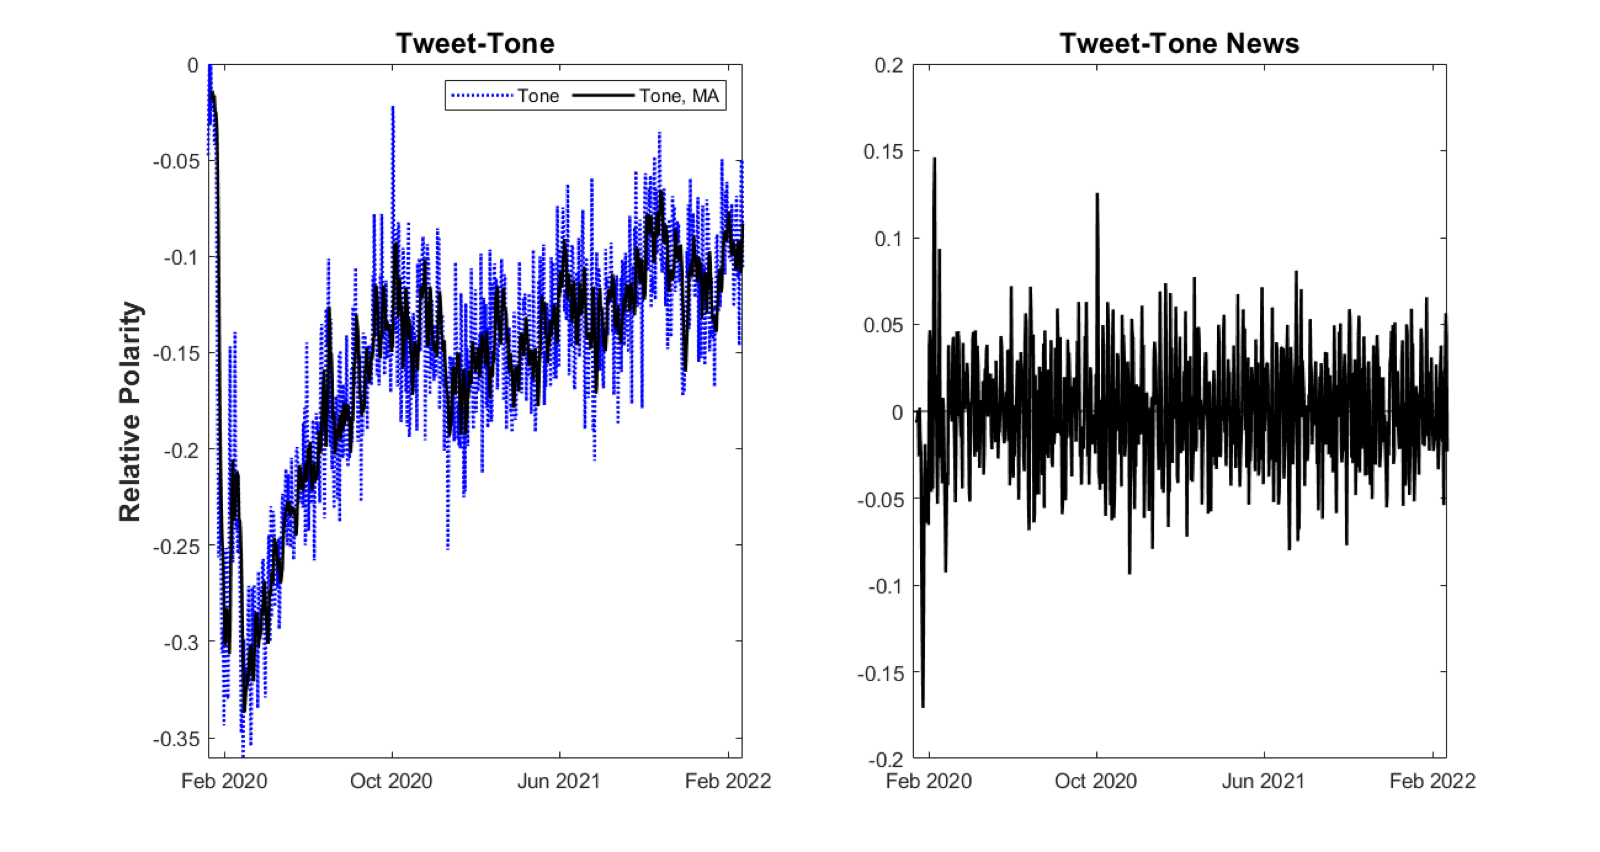
The tone of the tweets* moves with the observed contagion. It turned very negative by the end of January as conditions in China deteriorated. It improved in early February, when there was still no sign of mass contagion in Europe, and it fell again when the epidemic started in Italy.

*We measure tone with Polyglot, a multilingual algorithm that reads each tweet and classifies its words as positive (+1), negative (−1), or neutral (0). Following Twedt and Rees (2012), each tweet's tone is

$$\text{Tone} \;=\; \frac{\#\,\text{positive words} \;-\; \#\,\text{negative words}}{\#\,\text{positive words} \;+\; \#\,\text{negative words}}$$

We compute this at the country level, hourly and daily, using only original tweets (not retweets). We then aggregate across countries to get a global measure.

Interactive

Tone of COVID-related tweets by major newspapers

Daily world tone and 5-day moving averages for the world, advanced, and emerging economies.

From tone to news

Extracting news from the tone

For the asset pricing analysis we focus on innovations to the tone of our tweets. A simple way to get them is to take the difference between the tone on day \(t\) and its 5-day backward-looking moving average at \(t-1\):

$$news_t \;=\; \text{Tone}_t \;-\; \frac{1}{5}\sum_{j=1}^{5}\text{Tone}_{t-j}$$

The resulting series is close to serially uncorrelated.

Interactive

Tone news (tone minus its moving average)

The world series is shown first. Click Advanced or Emerging in the legend to add them.

Daily innovations in tweet tone.

Asset pricing

The market price of contagion risk

Every day we sort countries into three portfolios by their share of COVID-19 cases the previous day, separately for advanced (AE) and emerging (EE) economies. The H (L) portfolio holds the countries with the most (fewest) cases. We also consider a strategy that is long H and short L (HML). Each portfolio's exposure to global contagion news moves with its share of cases, \(X_{f,t}\):

$$\begin{aligned} r^{ex}_{f,t+1} &= \bar r^{ex}_{f,t} + \beta_{f,t}\cdot news^{glob}_{t+1}, \qquad f\in\{H,M,L\}\\[2pt] \beta_{f,t} &= \beta_0 + \beta_{f,1}\,X_{f,t}\\[2pt] \frac{\partial\, \bar r^{ex}_{f,t}}{\partial X_{f,t}} &= \lambda\,\beta_{f,1} \end{aligned}$$

Here \(\lambda\) is the market price of risk (MPR) of global contagion news. We estimate the model by GMM. All portfolios have a significant exposure to contagion news, and the portfolio with the highest share of cases tends to be the most exposed. That sign is what we expect: bad news about the global tone of tweets is an adverse shock to equity returns.

Result

Given our specifications and estimation uncertainty, 0.3% is a reasonable lower bound on the daily market price of risk of contagion news. Two things make this number plausible:

  1. This is not the MPR of a financial factor, and the estimated betas are very small.
  2. Contagion risk comes in waves with a short half-life, so assets' exposure to it is small and fades quickly.

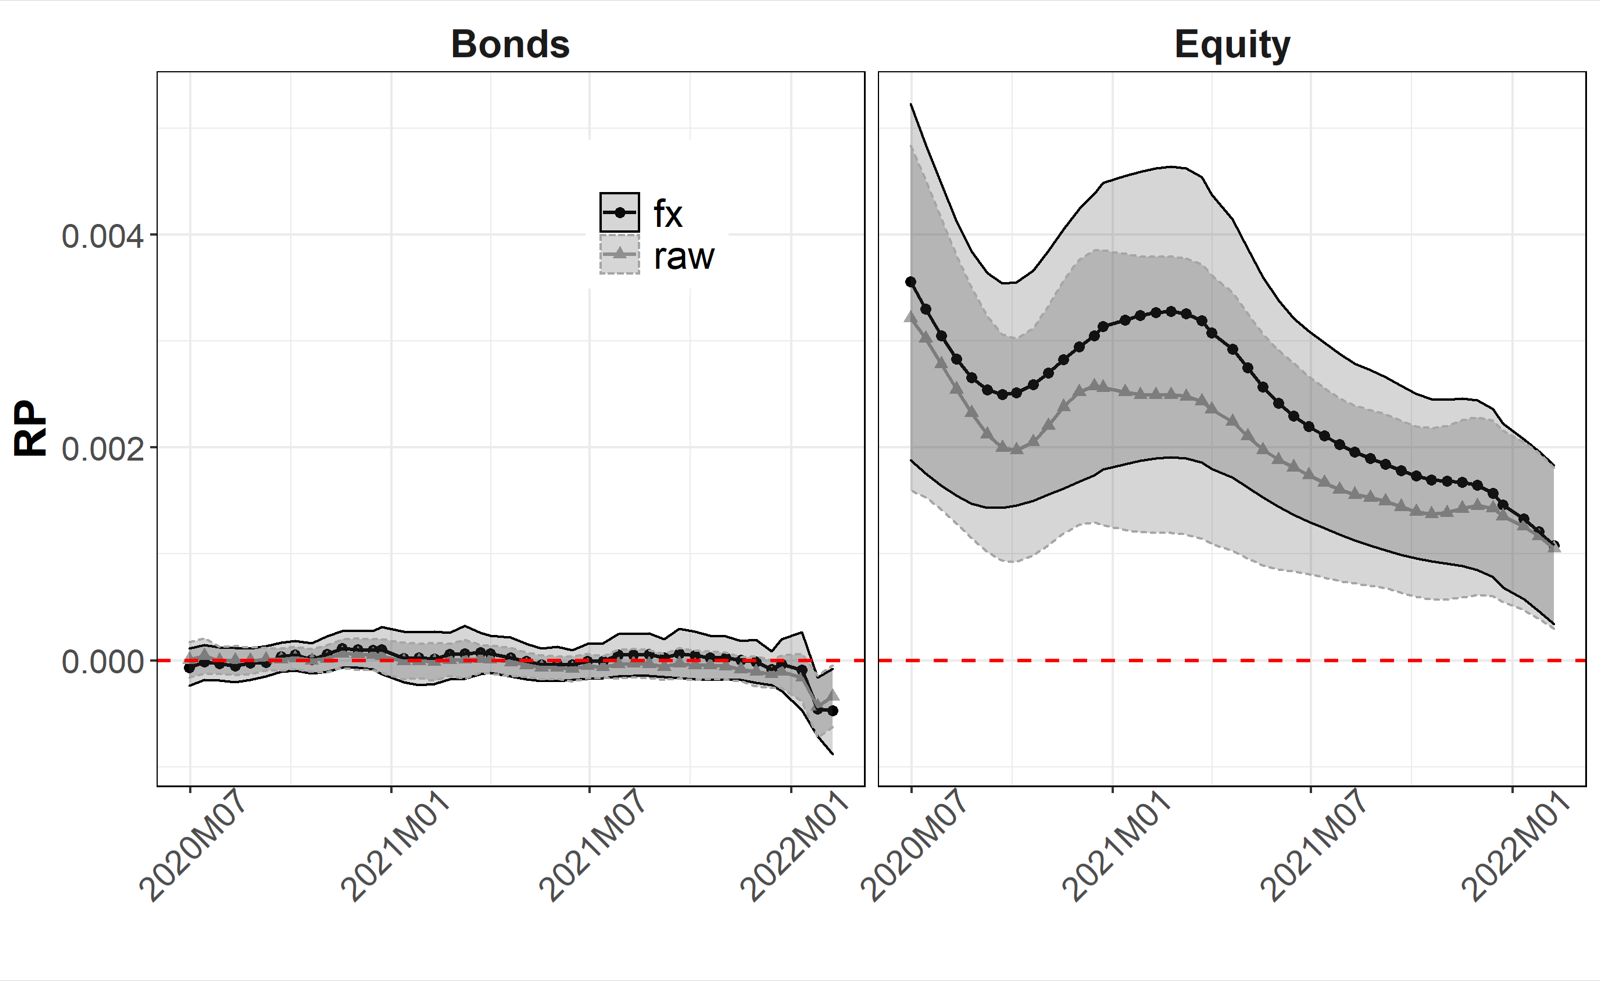
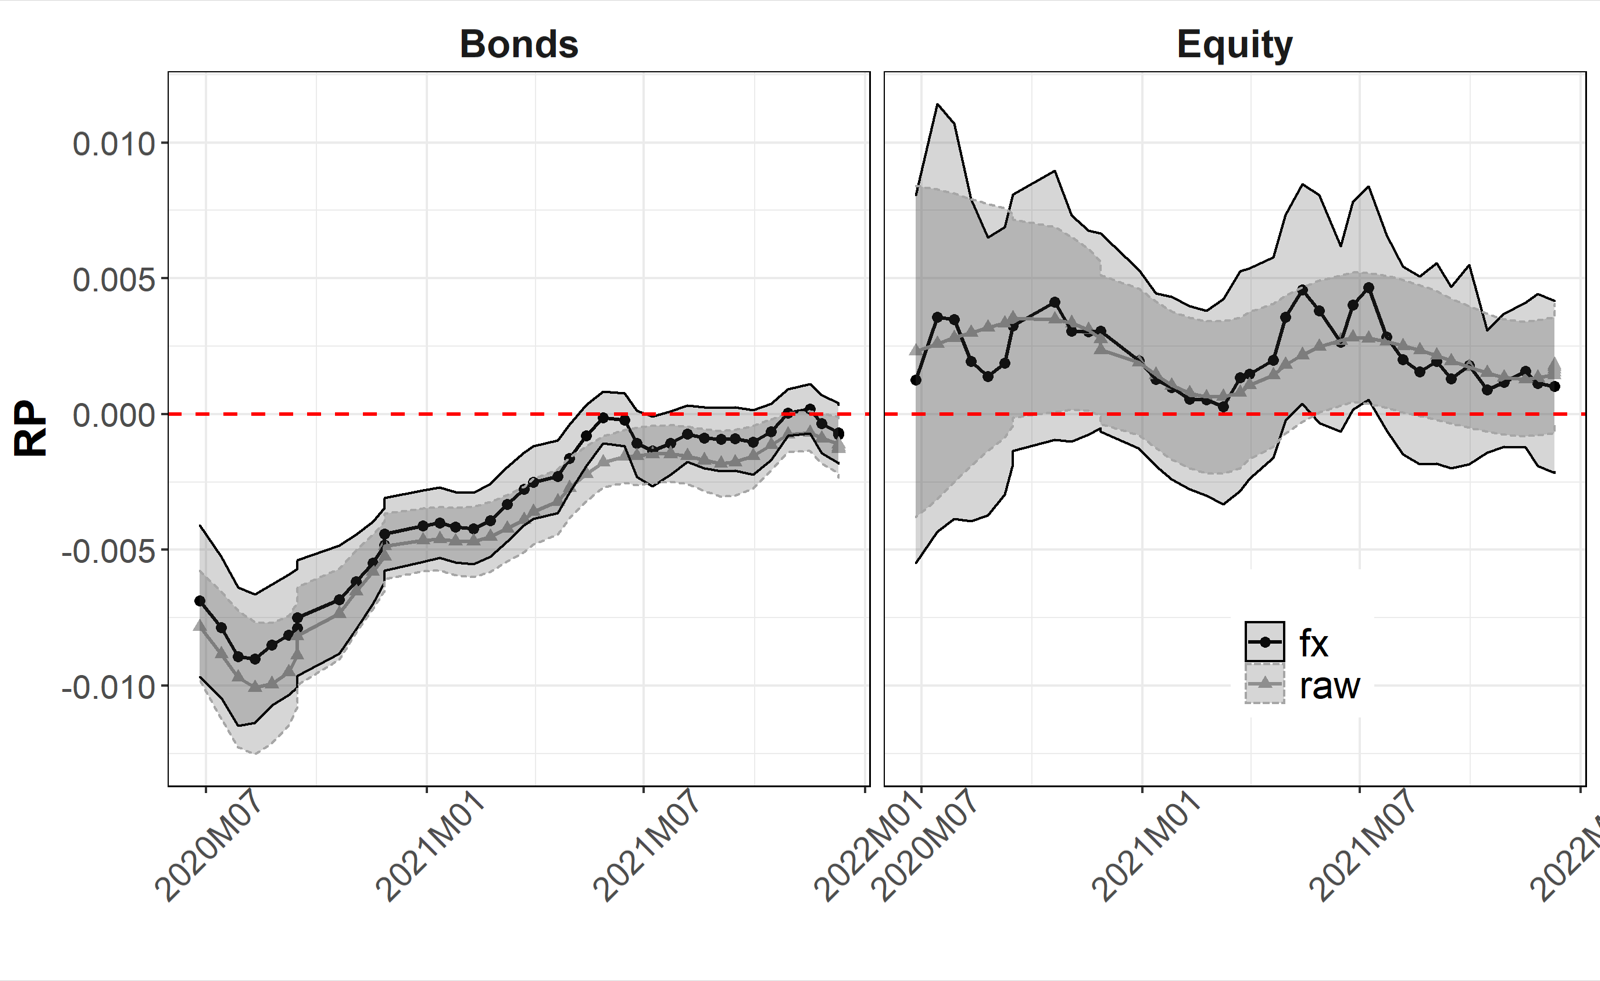
Equities are more exposed to contagion risk than bonds. An HML-COVID strategy on bonds earns a zero risk premium in advanced economies and a negative one (an insurance premium) in emerging economies. On equities, the same strategy earns a positive risk premium in both groups, smaller but better identified in advanced economies.
High-minus-Low COVID

Heterogeneous exposure: the HML strategy

The HML strategy isolates how differently countries are exposed to contagion risk.

Interactive

Estimated expected excess return, HML portfolio

Long High-COVID, short Low-COVID countries. Bonds on the left, equities on the right.

What we observe
  1. Bonds became less risky in High-COVID countries than in Low-COVID countries. In other words, bonds are relatively safe assets in High-COVID countries, so an HML-COVID strategy on bonds earns an insurance premium.
  2. In advanced economies this premium is very small, consistent with the muted bond response around medical announcements. In emerging economies the insurance premium is large, in both local currency and USD.
Figures from the published paper
Daily COVID tweets by country, with the date each country passed 100 confirmed cases
Figure 5

Information diffusion and attention across countries. Daily tweets by major newspapers. Marker size reflects retweets; the vertical line marks 100 confirmed cases.

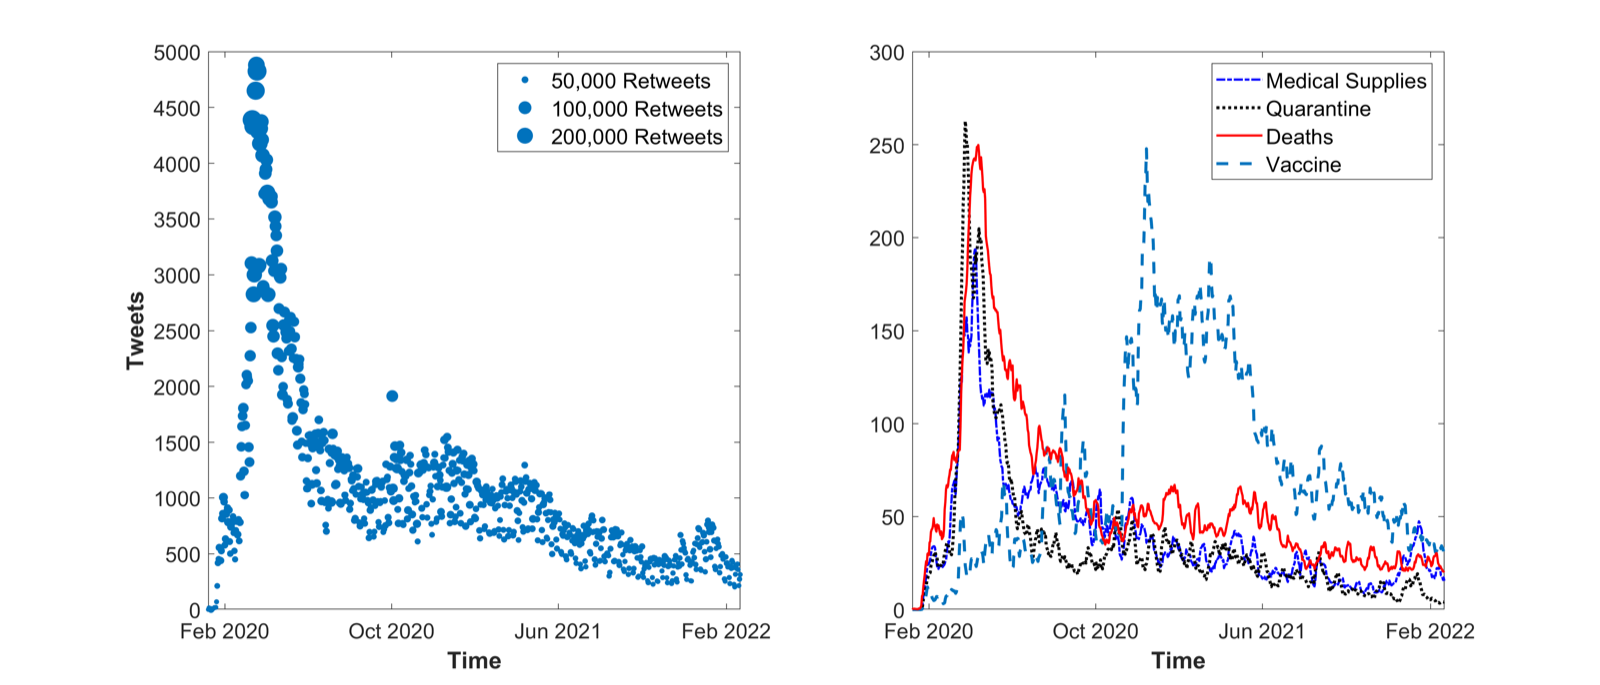
Global daily COVID tweets and topic breakdown
Figure 6a

Global information diffusion, with tweets about death risk, medical supplies, quarantine, and vaccines.

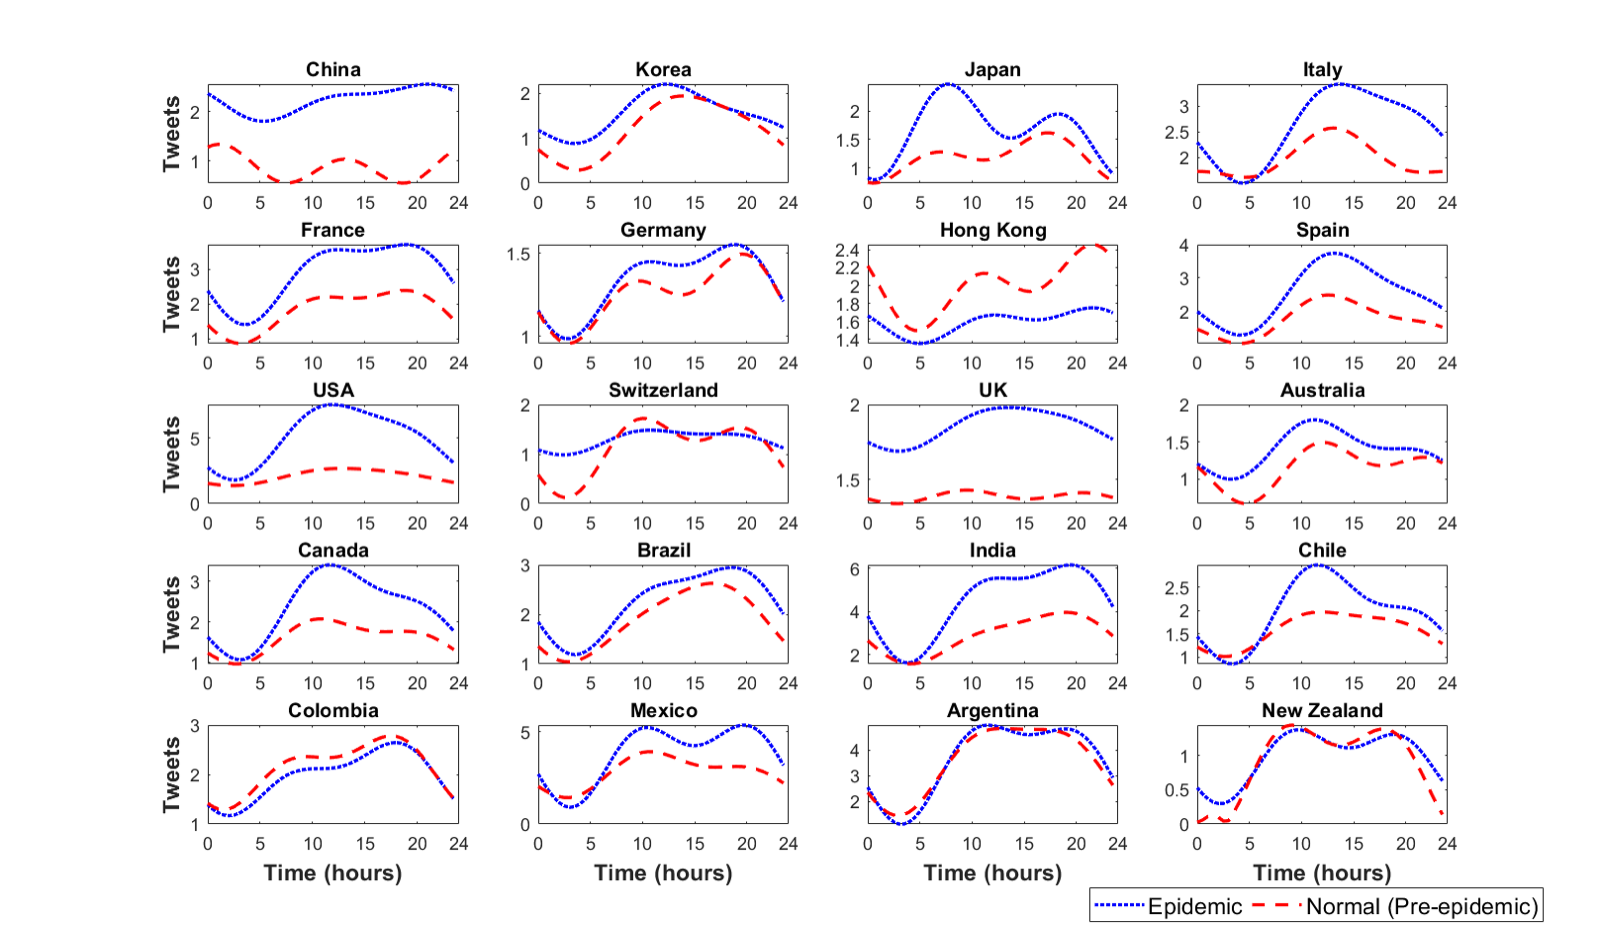
Intraday tweet counts per 30 minutes, first wave versus pre-epidemic
Figure 7

Intraday information diffusion: first wave (dotted) vs. pre-epidemic (dashed), local time.

Twitter-based COVID-19 factor
Figure 8

Twitter-based COVID-19 factor: global tone and its innovations.

Advanced economies
Sequentially estimated HML-COVID risk premium, advanced economies
Emerging economies
Sequentially estimated HML-COVID risk premium, emerging economies
Figure 9

Sequentially estimated risk premia on the HML-COVID strategy (first sample ends June 2020; two weeks added at a time). Shaded areas are 90% confidence intervals.

The newspapers dataset (Table 3)
CountryProvidersTweetsRetweetsLikesMortalityQuarantineMed. supplyVaccines
Argentina477,3381,205,2693,154,15813%10%14%63%
Australia417,641144,685348,07419%39%12%29%
Brazil432,5521,331,6418,705,98345%8%15%32%
Canada548,545442,675861,10233%10%17%40%
Chile433,954408,095630,82556%6%10%28%
China332,791947,7062,580,17739%14%19%28%
Colombia432,877474,7951,450,80817%12%25%45%
France447,0591,424,7172,384,87925%26%27%22%
Germany412,213147,977331,43420%24%20%35%
Hong Kong321,204419,964606,52017%32%21%31%
India4103,907937,4685,611,87432%23%16%29%
Italy333,696265,658715,06410%32%29%28%
Japan418,984156,845277,46118%13%30%39%
Korea413,45982,445143,64944%10%26%20%
Mexico479,2441,625,6874,262,38214%11%25%50%
New Zealand39,52045,474169,92010%40%15%35%
Spain438,8652,668,1884,792,04730%20%14%36%
Switzerland48,39037,17347,19122%20%25%33%
UK425,3561,145,4042,286,49127%30%15%29%
USA11116,3657,264,22517,259,74729%7%23%41%
Total84803,96021,176,09156,619,78626%19%20%35%

Topic columns give the share of tweets mentioning each topic. Sample: 01/01/2020–02/22/2022.